UK airline schedule company OAG, whose air schedule guide was originally called ‘Official Aviation Guide Of The Airways’ has published the top 10 airline routes by revenue. And one airline’s flying generated over a billion dollars last year on a single route: British Airways flying between New York JFK and London Heathrow.
In fact with 5 of the 8 highest-revenue routes for any single airline involving Heathrow it’s no wonder that:
- London Heathrow is congested and a slot there has sold for as much as $75 million
- British Airways wants to avoid competition (a third runway which would open up capacity)
- BA is able to get buy putting the former head of low cost carrier Vueling in charge and degrading the product
- They can offer a poor premium cabin product, with plenty of seats

Here’s the full list showing the total revenue an airline earns on each route, and how much revenue per flight hour they generated.
| Airline | Market | 2017 Revenue | Scheduled Hours | Revenue Per Hour | ||||
| British Airways | LHR-JFK | 1,037,724,867 | 42,117 | 24,639 | ||||
| Qantas | SYD-MEL | 854,692,402 | 35,264 | 24,237 | ||||
| Emirates | LHR-DXB | 819,409,702 | 32,378 | 25,308 | ||||
| Singapore | LHR-SIN | 709,730,107 | 38,883 | 18,253 | ||||
| American | LAX-JFK | 698,674,321 | 50,581 | 13,813 | ||||
| United | SFO-EWR | 687,674,312 | 56,693 | 12,130 | ||||
| Cathay Pacific | LHR-HKG | 631,855,868 | 44,206 | 14,293 | ||||
| Qatar | LHR-DOH | 552,658,316 | 31,264 | 17,677 | ||||
| Air Canada | YVR-YYZ | 552,264,972 | 48,253 | 11,445 | ||||
| Singapore | SYD-SIN | 543,723,893 | 27,847 | 19,525 |
The highest revenue generated per route isn’t New York JFK – London Heathrow. It’s Emirates’ London Heathrow – Dubai. There’s a reason they run 6 daily Airbus A380s. No matter what you’ve heard from whiny competitors who don’t want Emirates in their back yard, they’re going where the money is.
United crushes San Francisco to the New York area, they’re flying between two of their hubs, while American generates an enormous amount of cash between New York JFK and Los Angeles. No doubt this is why American’s Senior Vice President for Los Angeles Suzanne Boda told me she wishes she had more than 10 first class seats on each flight to sell.
Air Canada’s Toronto – Vancouver operation is very much in line with the US premium transcons, which helps explain why they’ve invested in improving the premium product on that route.
There’s only one short haul city pair that makes the list: Sydney – Melbourne.

Qantas in Melbourne
Qantas runs about three dozen flights a day between the two largest cities in Australia, mostly with Boeing 737s but with a few widebodies thrown in as well.

Very interesting and you didn’t use “old stock pictures ” !!!!!
They should do it for city pairs for all airlines. NYLON probably still wins, but may be some surprises.
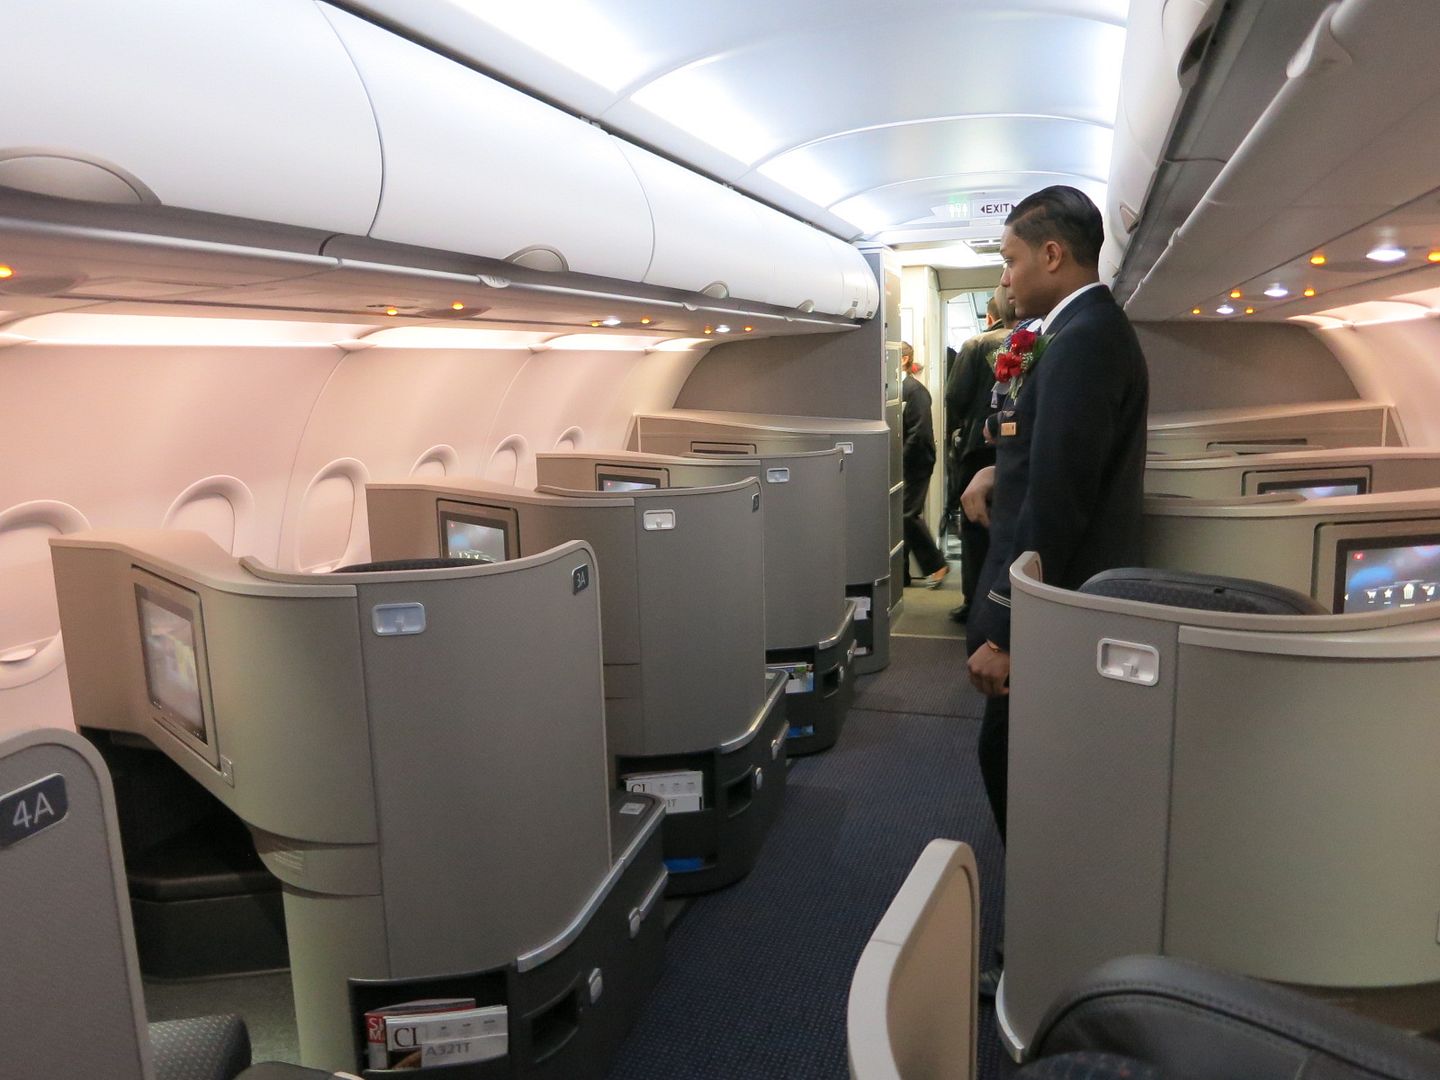
AA wants more seats in F on the 321T for what? More non-rev employees?
I like the idea of presenting the data as Revenue per Block Hour, as that gives an additional lens beyond RPM/RPK. However, any idea how OAG allocated revenue to the routes? We know that revenue allocation can be tricky with airlines and their networks, and I have to believe that there’s some shenanigans occurring at every airline with respect to which routes are winners and losers.